
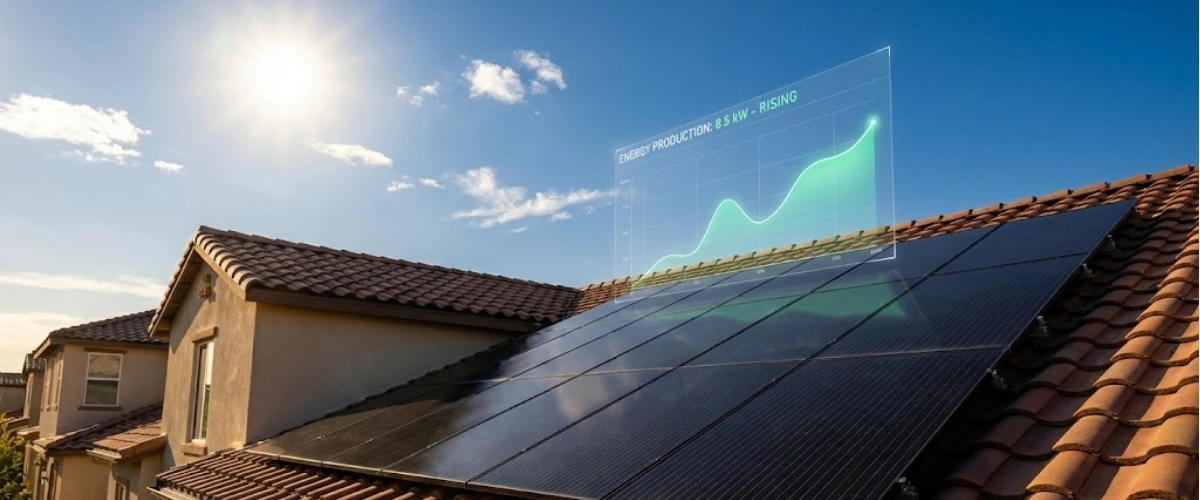
Real production expectations for Los Angeles solar systems across all seasons, from summer peaks to June gloom challenges.
You check your solar app in January and your heart sinks. Your system produced 15 kWh yesterday, but back in July it was hitting 45 kWh on clear days. Is something broken? Should you call your installer?
Here's the reality most Los Angeles homeowners don't learn until after installation: solar production isn't constant. It fluctuates with seasons, weather patterns, and even the marine layer that rolls in from the Pacific. Understanding these variations helps you set realistic expectations and size your system correctly from the start.
Let's break down exactly what you can expect from your solar panels throughout the year in Los Angeles, why production dips happen, and how to ensure your system delivers real savings in every season.
Solar panels generate electricity based on available sunlight, which varies significantly throughout the year in Southern California. A typical residential system in Los Angeles produces anywhere from 20-60% less energy in winter months compared to peak summer production.
This isn't a defect. It's physics.
Los Angeles experiences shorter daylight hours from November through February, with the sun taking a lower path across the sky. December brings roughly 10 hours of daylight compared to June's 14+ hours. That's four fewer hours of production opportunity, plus the sun's angle reduces panel efficiency during winter months.
Most LA homeowners with a properly sized 8-10 kW system can expect daily production ranging from 25-35 kWh in winter to 50-70 kWh during summer peaks. Understanding these ranges helps you evaluate quotes and avoid undersized systems that can't cover your annual usage. Learn more about solar panel production in Southern California to set realistic expectations.
Los Angeles isn't just sunshine and palm trees. The region experiences distinct weather patterns that directly affect solar output throughout the year.
That gray blanket rolling in from the coast each morning? It's cutting your early production by 30-50% until it burns off. Coastal LA areas like Santa Monica, Venice, and Manhattan Beach see the marine layer almost daily from May through August, typically clearing by 10-11 AM.
Inland areas like Pasadena, Burbank, and the San Fernando Valley experience less marine layer interference, which means better morning production. This 2-3 hour difference can add 5-8 kWh to your daily totals during peak season.
Despite being early summer, June often delivers some of the lowest production days in Los Angeles. The persistent overcast conditions reduce panel efficiency significantly. Many homeowners expect maximum production to start in June, but July and August typically outperform by 15-20%. Understanding how cloudy days affect solar output helps you avoid disappointment during this seasonal pattern.
When those hot, dry Santa Ana winds blow through in fall, solar panels actually love it. Clear skies, low humidity, and cooler panel temperatures create ideal conditions. Some of the year's best production days happen in October and November when Santa Anas clear the atmosphere completely.
Beyond seasonal changes, several factors determine how much electricity your panels produce each day.
South-facing roofs generate the most annual energy in Los Angeles, but southwest orientations perform nearly as well while capturing more valuable late-afternoon sun when electricity rates peak. The optimal solar panel angle for LA sits around 20-25 degrees, matching most residential roof slopes naturally.
East-west roof configurations split production, with morning generation on east-facing arrays and afternoon peaks on west-facing sections. This distribution can actually work better for household consumption patterns than pure south-facing systems.
Even partial shading from trees, chimneys, or neighboring structures reduces production substantially. Modern systems use microinverters or power optimizers to minimize shading losses, but prevention beats mitigation. A single tree branch shading 10% of your array can reduce total output by 30-40% during affected hours.
Not all solar panels perform equally over time. Lower-quality panels degrade faster, losing 0.8-1% efficiency annually compared to premium panels like QCells that maintain 0.25-0.4% annual degradation. Over 25 years, that difference compounds to 15-20% more lifetime production from quality equipment.
California's Net Energy Metering 3.0 policy changed the solar economics fundamentally. Unlike NEM 2.0 customers who received full retail credit for excess production, NEM 3.0 participants get roughly 75% less compensation for grid exports.
This means maximizing self-consumption during production hours became critical. You want to use as much solar energy directly rather than sending it to the grid for minimal credit.
Pairing solar with battery storage allows you to capture excess midday production and deploy it during evening peak hours when electricity costs 3-4x more. Without batteries under NEM 3.0, you're essentially donating excess production to the utility for pennies. Learn how solar batteries can maximize your savings under the new rate structure.
A properly sized battery system stores 10-15 kWh of surplus generation, enough to power your home through evening hours without pulling expensive grid power. This strategy transforms mediocre ROI into compelling savings that often exceed solar-only economics from the NEM 2.0 era.
When production variations already exist from seasonal and weather factors, the last thing you need is inconsistent panel performance adding more uncertainty.
US Power's exclusive partnership with QCells ensures Los Angeles homeowners receive American-made panels engineered for durability and consistent output. These aren't imported panels assembled elsewhere—QCells panels are American-made in Georgia with strict quality controls.
By going factory-direct, US Power eliminates distributor markups that typically add 15-20% to system costs. You're paying for the panels and installation, not middleman profits. This pricing structure allows for properly sized systems without budget compromises that leave you undersized and disappointed with results.
Most solar companies offer patchwork warranties: 25 years on panels from the manufacturer, 10 years on workmanship from the installer, separate inverter coverage. US Power provides a single 25-year warranty covering panels, workmanship, and performance guarantees. If production falls short, you're covered completely.
Many LA solar companies quote 8-12 week installation timelines, sometimes stretching to 5-6 months with permitting delays. US Power's streamlined process leverages CSLB-licensed consultants who handle permitting efficiently, getting systems operational in 3-4 weeks from approval. Faster installation means you start capturing production sooner.
The biggest mistake LA homeowners make is undersizing their solar array based on summer production estimates. Your system needs to generate enough annual energy to cover 12 months of usage, not just June through September.
Here's the smart approach: review your last 12 months of SCE bills to identify total annual consumption. A properly sized solar system should generate 105-110% of that usage to account for degradation and occasional underproduction from weather events.
For most Los Angeles homes averaging 800-1,000 kWh monthly usage, this translates to an 8-10 kW system. Homes with EVs, pools, or higher consumption typically need 10-14 kW systems. Don't let budget constraints push you toward smaller systems that can't deliver adequate offset.
Some solar companies propose deliberately undersized systems to hit attractive price points, knowing the monthly payment looks better than utility bills. But if your system only covers 70% of usage, you're still paying SCE for the remaining 30% at inflating rates forever.
Within 5-7 years, those residual utility costs often exceed the savings from going slightly larger initially. Always size for complete offset when possible.
Let's look at actual data from US Power installations across Los Angeles to set realistic expectations. Real solar panel performance data from Southern California homes shows these production patterns.
A 10 kW system in Pasadena with optimal south-facing orientation produces approximately:
Summer (June-August): 55-65 kWh daily averageFall (September-November): 45-55 kWh daily average
Winter (December-February): 25-35 kWh daily averageSpring (March-May): 40-50 kWh daily average
Annual total: 16,000-18,000 kWh
Compare this to a coastal Venice installation with the same 10 kW system:
Summer: 50-60 kWh daily (marine layer impact)Fall: 40-50 kWh dailyWinter: 22-32 kWh dailySpring: 38-48 kWh daily
Annual total: 14,500-16,500 kWh
The 1,500-2,000 kWh annual difference comes purely from location-based weather patterns. Both systems perform exactly as designed, but coastal fog reduces overall production by roughly 10%.
Understanding month-by-month patterns helps you avoid panic when production naturally dips.
These months deliver your lowest production, often 40-50% below summer peaks. December typically brings the weakest performance due to shortest days and frequent storm systems. Don't be alarmed by daily totals in the 20-30 kWh range for a 10 kW system—this is completely normal. Learn more about winter solar production to understand seasonal expectations.
Production climbs steadily through spring as days lengthen and the sun's angle improves. May approaches summer-level output, but June often underperforms due to persistent morning clouds.
These months deliver maximum production with long days, high sun angles, and typically clear skies by mid-morning. Your best production days of the entire year happen during this window.
Fall maintains good production levels with occasional Santa Ana wind events creating exceptional days. Output gradually decreases as winter approaches.
Solar panel production in Los Angeles follows predictable patterns throughout the year. Summer brings peak performance with 50-70 kWh daily from properly sized systems, while winter production dips to 25-35 kWh daily. These variations are normal, expected, and factored into proper system sizing.
The key to maximizing savings under NEM 3.0 is pairing adequate solar capacity with battery storage, allowing you to capture midday production for evening use. This strategy transforms seasonal variations from a concern into an opportunity for deeper utility independence.
US Power's factory-direct QCells systems deliver reliable, consistent performance backed by comprehensive 25-year warranties and 3-4 week installation timelines. With 180+ five-star Google reviews and CSLB-licensed consultants handling every detail, Los Angeles homeowners get properly sized systems that perform as promised through every season.
Stop watching your meter spin and your bills climb. Start generating your own power year-round with a system built for Los Angeles conditions from day one.

Maximize solar ROI in 2025 with smart planning and high-efficiency Qcells solar.
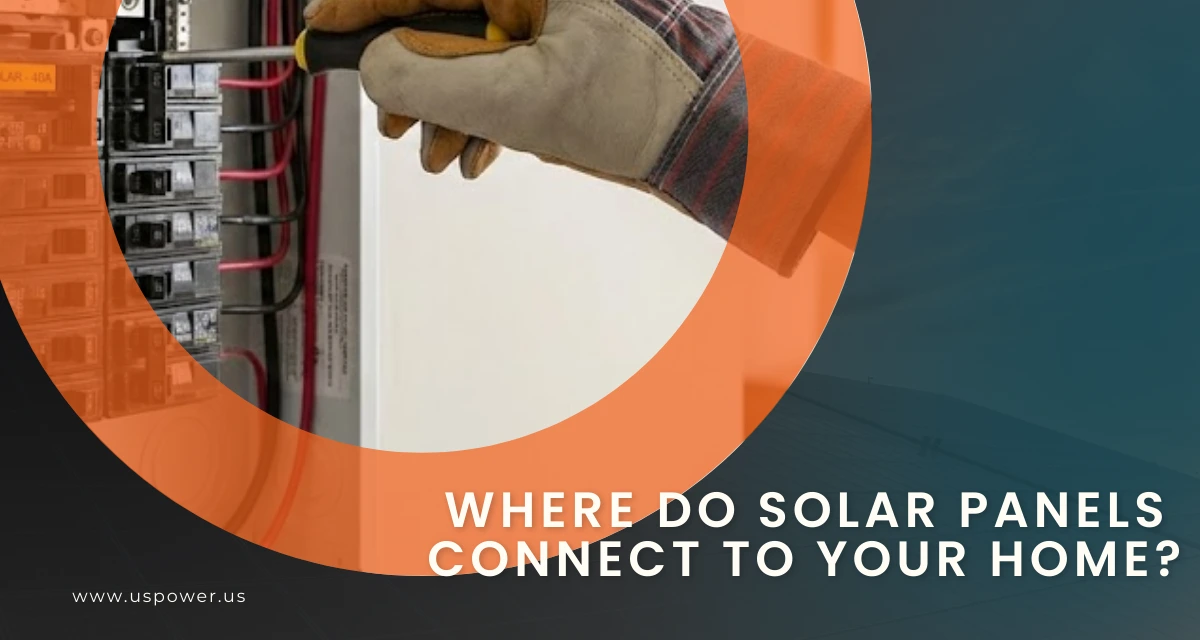
Understanding solar connection points matters more than you think. Safety First!
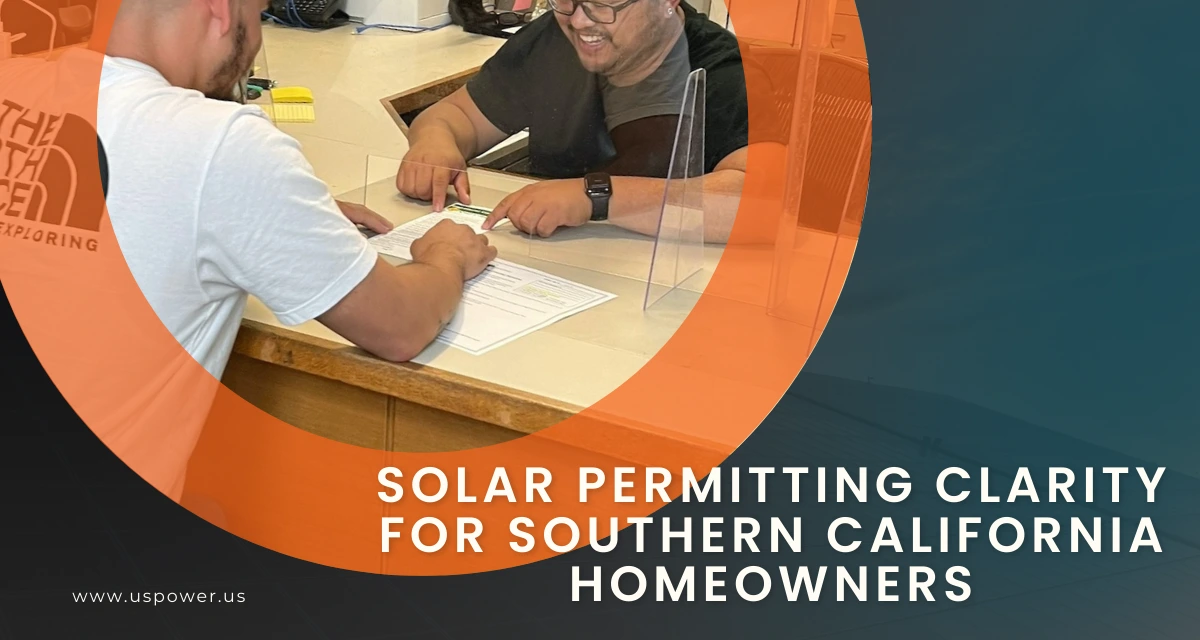
Avoid permit headaches and install your solar panels confidently. US Power can help.


Derechos de autor © 2025 US POWER | Energía solar y techosUS Power - Axia by QCells. All Rights Reserved.
¡Obtenga una estimación solar instantánea usando el satélite!