

SCE's average residential rate is 34.4 cents per kWh and SDG&E's is 45.5 cents as of June 2026, roughly double 2016 levels while inflation rose 42%. Wildfire costs, grid spending and billing changes drive most of it. Here is what you pay for and how to cut it.
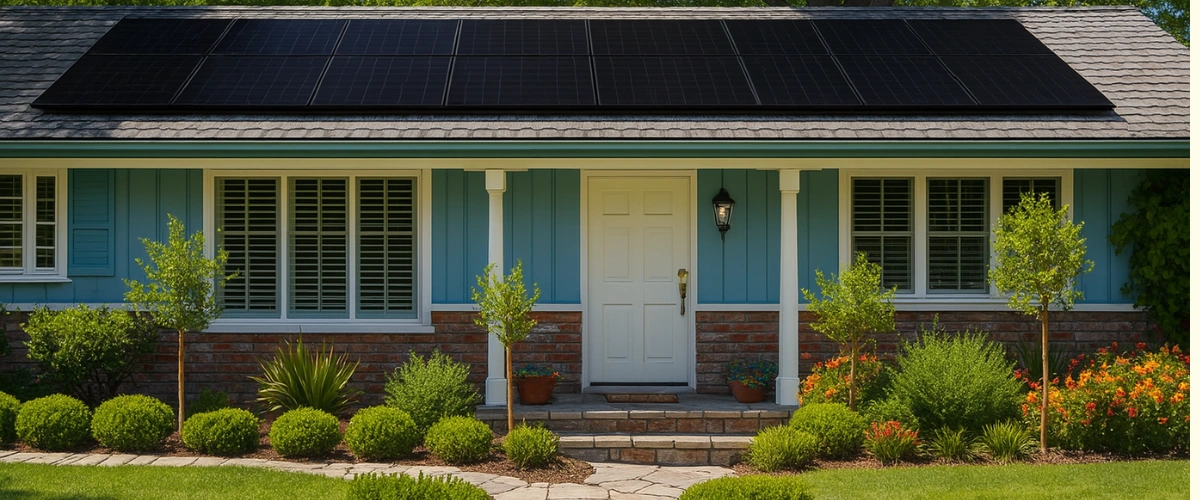
You open your Edison bill, and it is higher than last summer even though you did not run the AC more. You check the rate, and it is higher than it was five years ago. You are not imagining it.
Southern California electricity bills have roughly doubled in a decade. This guide explains where that money goes, what changed in the past year, and what you can do about it, from rate plans to rooftop solar.
As of June 2026, SCE's average residential rate is 34.4 cents per kWh, and its average residential bill is about $187 a month. SDG&E's average residential rate is 45.5 cents per kWh, one of the highest of any large utility in the country.
| Utility | Avg. residential rate | As of | Change since 2016 | Wildfire share of revenue | Solar export credit |
|---|---|---|---|---|---|
| SCE | 34.4¢/kWh | June 1, 2026 | +101% | 14% ($2.69B) | NEM 3.0, about 5–8¢/kWh |
| SDG&E | 45.5¢/kWh | June 2026 | +97% | 14% ($675.7M) | NEM 3.0, about 5–8¢/kWh |
| LADWP | About 26–41¢/kWh by tier | Summer 2026 | Not in report | Not in report | Retail rate |
Figures come from the CPUC Public Advocates Office and each utility's rate advisories. The 10-year increases are from the Public Advocates Office Q2 2026 electric rates report, which compares January 2016 to June 2026.
Over that same period, general inflation rose 42%. SCE's residential rate rose 101% and SDG&E's rose 97%. In other words, electricity costs in Southern California have climbed more than twice as fast as everything else you buy.
On October 1, 2025, SCE raised residential rates 12.9%, from 31.2 to 35.3 cents per kWh. The typical bill went from about $171 to $193 a month. Rates eased slightly in January and June 2026, but they stayed near that new high. For a closer look at your Edison bill, see our guide on why your SCE bill keeps climbing.
Most SCE and SDG&E homes are on time-of-use plans, where power costs the most from 4 to 9 PM. Summer is when air conditioning runs through those hours, so a July bill can be far higher than an April bill at the same usage. The California Climate Credit, paid twice a year, softens the average a little. SCE reports that it lowers its effective average rate to about 33.2 cents per kWh.
The Public Advocates Office names three main drivers: wildfire costs, transmission and distribution spending, and rooftop solar incentives. Fuel and power plants are a much smaller part of the story.
As of January 2026, wildfire costs made up about 14% of SCE's revenue requirement ($2.69 billion) and 14% of SDG&E's ($675.7 million). That money pays for covered power lines, undergrounding, equipment inspections, insurance and past fire claims. SCE's June 2026 rate change added $380.7 million a year for wildfire liability self-insurance alone.
Utilities earn a return on the infrastructure they build, and the CPUC approves that spending in multi-year General Rate Cases. SCE's October 2025 increase included $1.685 billion to recover its 2025 General Rate Case, plus $536 million for past wildfire-risk work and storm restoration. The same decision already allows further increases in 2027 and 2028.
SCE equipment is believed to have sparked the January 2025 Eaton Fire, with damage estimates as high as $45 billion. SCE is paying claims through its compensation program, first from ratepayer-funded insurance and then from the state Wildfire Fund. In September 2025, SB 254 added $18 billion to that fund and extended the ratepayer charge that supports it through 2045. How much of the Eaton Fire cost ends up on bills is still being decided.
SDG&E added a Base Services Charge of about $24 a month in October 2025, and SCE followed in November 2025. Per-kWh prices dropped about 10% to offset it. Low-use households, including many condos, can pay more under the new structure, while high-use homes usually pay slightly less.
Utilities and the Public Advocates Office argue that older net metering shifts costs to customers without solar, estimating that shift at $8.5 billion in 2024. Solar advocates dispute the method, noting that rooftop solar lowers peak demand and grid spending. We break down both sides in our article on the solar cost shift debate.
What matters for a new system is simpler. Under NEM 3.0, SCE and SDG&E credit most exported solar at about 5 to 8 cents per kWh, far below the retail rate. New solar homes save money mainly by using their own power, not by selling it, so they add little to the shift either way.
If you live in the City of Los Angeles, LADWP is your utility, not SCE. LADWP's summer 2026 tiered rates run from about 26 to 41 cents per kWh, and it still credits solar exports at the retail rate. Its bills have risen too, but the rules above do not apply to it.
Solar replaces the power you would otherwise buy at 34 to 46 cents per kWh. The higher your rate, the faster it pays for itself.
Take an SCE home using 8,400 kWh a year, or 700 kWh a month. At 34.4 cents, that is about $2,890 a year in electricity. The same use at SDG&E's 45.5 cents costs about $3,820.
A Southern California roof produces roughly 1,500 kWh a year per kilowatt of panels, so covering that use takes about a 5.6 kW system, or 13 panels at 430 watts. At EnergySage's California average of $2.52 per watt, that system costs about $14,100 before incentives. Run your own numbers with the US Power solar calculator.
Under NEM 3.0, sizing is less forgiving. An oversized system exports power for pennies, and an undersized one leaves you buying peak power. Every US Power consultation starts with a real 12-month bill analysis, so the design matches when you actually use electricity.
EnergySage data puts the average California solar payback at about 7.7 years. SDG&E customers often come out ahead of that because their rates are higher. The 30% federal residential solar tax credit expired on December 31, 2025, so equipment price matters more than it used to.
US Power offers exclusive factory-direct Qcells pricing, roughly 15-20% below typical market pricing, on American-made panels. Timing also matters: California's solar property tax exclusion only covers systems completed before January 1, 2027. Our guide on why now is the time to take control of your energy in SoCal covers that deadline.
SCE and SDG&E time-of-use plans charge the most from 4 to 9 PM, just as solar output fades. A battery stores midday solar and runs your home through those evening hours instead of exporting power for a few cents. For most SCE and SDG&E homes under NEM 3.0, that is where a battery earns its cost.
Batteries also keep key circuits running during outages and Public Safety Power Shutoffs. See whether one fits your home in our guide on whether batteries are worth it in California.
SCE and SDG&E offer several time-of-use plans with different peak windows. If most of your use falls in the evening, the wrong plan can cost you. Both utilities offer free rate comparisons on your online account.
Income-qualified households get lower rates and a much smaller Base Services Charge, about $6 a month for CARE and $12 for FERA. Many eligible families never apply.
Run the dishwasher, laundry, pool pump and EV charger before 4 PM or after 9 PM. On a time-of-use plan, the same kWh can cost far less outside the peak window.
Ask every installer to size your system from 12 months of usage, not a single bill. Compare quotes on estimated annual production and price per watt. Our homeowner's guide to going solar in California walks through each step.
Both utilities show hourly usage in your online account. Look for power drawn overnight or at the same hour every day. Old refrigerators, pool pumps on long timers and always-on electronics often show up as a steady base load you can cut.
Southern California electricity bills are high because rates have doubled since 2016, driven by wildfire costs, grid spending and new billing rules. With SCE at 34.4 cents and SDG&E at 45.5 cents per kWh, every kWh you produce yourself is worth more than ever.
US Power builds every design from your real 12-month bill analysis, prices Qcells panels factory-direct, backs each system with a 25-year comprehensive warranty, and typically installs in 3 to 4 weeks once the design is approved. More than 200 five-star Google reviews come from homeowners across Southern California. To see what your home could save, book your free 12-month bill analysis.
You cannot control your utility's rates. You can control how much you buy.


Key prep steps for LA homeowners to ensure smooth solar installation and savings.

Explore five signs your Pasadena home is solar-ready in 2025. Act fast today!
Your Texas electric bill is about to get a lot more expensive. Get your saving now!








Copyright © 2026 US Power - Axia by QCells. All Rights Reserved.
Get an instant solar estimate using satellite!