

Solar panels in California cost about $2.50 to $3.60 per watt in 2026, or roughly $18,000 to $30,000 for a typical home before incentives. With the federal homeowner credit gone and NEM 3.0 in place, quotes vary widely. Here are real costs by size, utility and battery, plus the payback math.
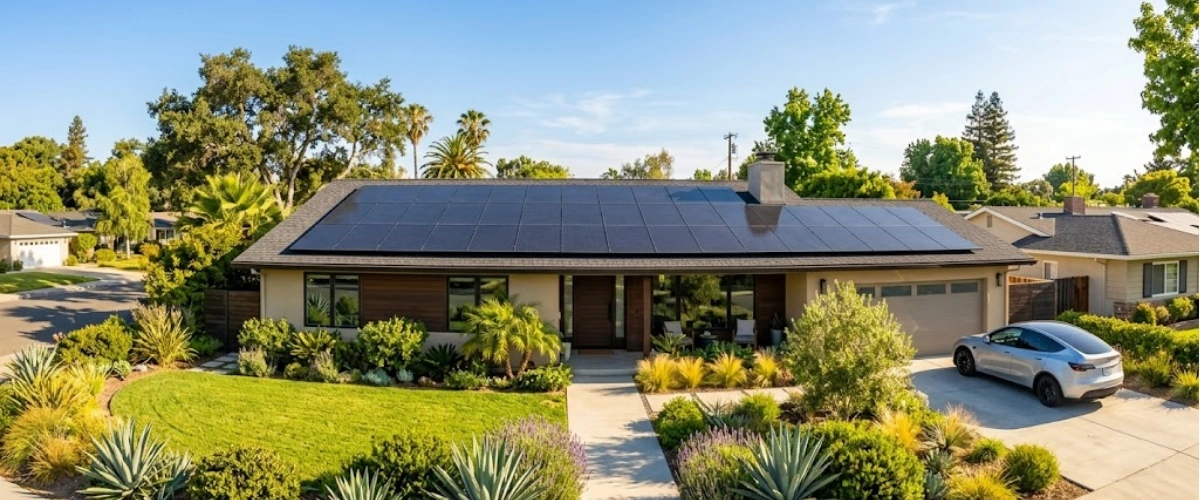
Solar panels in California cost about $2.50 to $3.60 per watt installed in 2026, so a typical 8 kW system runs about $21,000 before incentives. Adding a 13 kWh battery adds roughly $11,500 to $15,500.
You open your summer bill from SCE or PG&E, see another number north of $250, and start pricing solar. Then the quotes come back $10,000 apart for what looks like the same system. The real solar panel cost California homeowners pay in 2026 depends on system size, your utility, whether you add a battery, and how you pay for it.
This guide gives you real 2026 numbers for each of those pieces. You will see costs by system size, cost per watt by region and utility, a worked NEM 3.0 payback example, the incentives that still exist, and how California compares to the other states US Power serves.
Here is what this guide covers:
Solar panels in California cost about $2.50 to $3.60 per watt installed in 2026, which works out to roughly $18,000 to $30,000 for a typical 7 to 8 kW home system before any incentives. The low end reflects marketplace quotes, and the high end reflects full-service installed prices tracked by federal researchers.
According to EnergySage's October 2026 California data, the average quoted price is $2.52 per watt, the average system is 8.44 kW, and the average system costs about $21,235 before incentives. Most California quotes on that platform fell between $18,050 and $24,420.
Lawrence Berkeley National Laboratory's 2026 distributed solar data update puts the national median installed price for homeowner-owned systems at $3.60 per watt in 2025, down from $4.10 the year before. That figure includes many full-service installers and complex roofs, so treat it as the upper middle of a fair range, not a ceiling.
Size drives most of your price. The table below applies the $2.50 to $3.60 per watt range to common home system sizes, plus the cost of adding a typical 13 kWh battery. Output estimates assume about 1,450 to 1,650 kWh per installed kW each year, which is typical for south- and west-facing California roofs in NREL PVWatts modeling.
| System size | Typical 2026 California cost (before incentives) | Estimated yearly output |
|---|---|---|
| 4 kW | $10,000 to $14,400 | 5,800 to 6,600 kWh |
| 6 kW | $15,000 to $21,600 | 8,700 to 9,900 kWh |
| 8 kW | $20,000 to $28,800 | 11,600 to 13,200 kWh |
| 10 kW | $25,000 to $36,000 | 14,500 to 16,500 kWh |
| 12 kW | $30,000 to $43,200 | 17,400 to 19,800 kWh |
| Add a 13 kWh battery | $11,500 to $15,500 more | Stores daytime solar for 4 to 9 PM use |
A home that uses about 750 kWh a month usually needs a 6 to 7 kW system. If you want a quick estimate based on your own bill, run your numbers through the US Power solar calculator. For a square-footage view of sizing, see what solar costs for a 1,600 sq ft home.
A 6 kW system bought for $18,000 that produces about 9,300 kWh a year will generate roughly 210,000 kWh over 25 years after normal panel aging. That works out to about 8 to 9 cents per kWh, compared with the 33 to 46 cent average rates at California's big three utilities in 2026. That gap is why solar still pencils out here even after the federal credit ended.
Cost per watt barely changes across California, ranging from about $2.45 to $2.54 in EnergySage's October 2026 city data. What changes is your system size, your electric rate, and how your utility credits exports, which together decide your payback.
| Region (utility) | Cost per watt, average size and price | Average rate and estimated payback |
|---|---|---|
| Orange County, Irvine (SCE) | $2.45/W, 7.68 kW, about $18,840 | 34.4 cents/kWh, about 7.6 years |
| Bay Area, San Jose (PG&E) | $2.53/W, 7.85 kW, about $19,900 | 33.7 cents/kWh, about 7.7 years |
| San Diego (SDG&E) | $2.54/W, 6.54 kW, about $16,650 | 45.5 cents/kWh, about 7.2 years |
| City of Los Angeles (LADWP) | $2.51/W, 9.85 kW, about $24,730 | About 24 to 28 cents/kWh, about 5.3 years |
| California average | $2.52/W, 8.44 kW, about $21,235 | 34.7 cents/kWh, about 7.7 years |
Sources: cost, size and payback from EnergySage city pages updated October 23, 2026. SCE, PG&E and SDG&E rates are Q2 2026 system averages from the CPUC Public Advocates Office Q2 2026 rates report. LADWP's range comes from its 2026 tiered and time-of-use schedules, and the statewide rate is EIA's June 2026 average.
Customers of the three investor-owned utilities who interconnect today go on the Net Billing Tariff, better known as NEM 3.0. Exported solar earns far less than you pay for grid power. Average export credits for 2025 and 2026 applicants run roughly 3.7 to 4.6 cents per kWh, versus retail rates above 33 cents.
That gap is why systems in these territories are sized closer to your actual use, and why batteries are common. SDG&E customers face the highest rates in the state, so each kWh you use on site saves the most there. For PG&E's credit schedule, see how PG&E solar export rates work in 2026.
LADWP is a municipal utility, so it is not on NEM 3.0. It still credits exported solar at close to the retail rate, which is why the City of Los Angeles shows the fastest payback in the table even though its rates are lower. Systems there also tend to be larger, since exports keep their value.
Other city utilities such as Burbank Water and Power and Pasadena Water and Power set their own rules and rebates, covered in the incentives section below. LADWP customers also have prepaid lease access, explained in Propel solar for LADWP customers.
Per-watt quotes in California are close to the national average, but total project costs often run $10,000 to $15,000 higher because so many California systems now include a battery. Labor, permitting and sales overhead add more on top.
Berkeley Lab reports that 37% of new U.S. home solar systems included storage in 2025, up from 25% in 2024, and California led that jump. Under NEM 3.0, a battery is how many homes get full value from midday solar instead of exporting it for a few cents. So the "California solar price" you hear about often includes storage.
California has some of the highest construction labor costs in the country. Fire code roof setbacks, structural review in some cities, utility interconnection steps and Title 24 rules for new homes all add design and labor time. Older homes also frequently need a main panel upgrade before solar can connect, which can add several thousand dollars.
Large national installers often run door-to-door teams paid on commission, and that cost lands in your quote. Equipment that passes through several distributors also picks up markup at each step. For a deeper look at these drivers, read why solar is so expensive in California and why some solar quotes cost more than others.
This is where sourcing matters. US Power buys American-made Qcells panels, built in Dalton, Georgia, at factory-direct Qcells pricing that runs 15% to 20% below market. Cutting distributor markup lowers your price without cutting equipment quality.
A typical home battery adds about $11,500 to $15,500 to a California solar installation in 2026. EnergySage's October 2026 California data puts the average at about $13,480 for a 13 kWh battery, or roughly $1,037 per kWh of storage before incentives.
Prices depend on capacity, brand and whether the battery is AC- or DC-coupled. A single 13 to 15 kWh unit covers evening use for most homes. Whole-home backup with large loads like central air or a well pump may need two units, which can push storage alone past $25,000.
For brand-by-brand pricing, see the full solar battery cost guide and what a Tesla Powerwall costs with Qcells solar.
A battery pays off when it moves solar from cheap export hours to expensive evening hours. Under NEM 3.0, each kWh you shift from export to your own 4 to 9 PM use is worth about 30 cents more at SCE's average rate. On a home that shifts 3,000 kWh a year, that is close to $900 in extra savings each year.
In LADWP territory, where exports still earn near-retail credit, a battery is mainly for backup power rather than savings. To weigh both cases, read whether battery storage is worth it in California in 2026.
Yes, for most homeowners. Solar in California typically pays for itself in about 7 to 11 years in 2026, and then keeps producing for 15 or more years after that. EnergySage's October 2026 data puts the statewide average payback at 7.7 years.
Here is the math for a home that uses about 9,000 kWh a year, which is a bill of roughly $258 a month at SCE's Q2 2026 average rate of 34.4 cents per kWh.
If rates stay flat, this system pays back in about 11 years. If rates rise 3% a year, a modest assumption given the last decade of SCE and PG&E increases, payback drops to about 10 years and 25-year savings reach roughly $61,000. Note that SCE's fixed base services charge stays on your bill either way.
Now add a 13 kWh battery for $13,500, bringing the total to $31,500. With the battery, the home uses about 85% of its solar on site instead of 45%.
With the same 3% rate growth, payback is still about 10 years, but 25-year savings climb to roughly $101,000. You also get backup power during outages. Batteries carry shorter warranties than panels, often 10 to 15 years, so plan for that in your long-term numbers.
Higher bills, south- or west-facing roofs and evening-heavy usage shorten payback. Shade, a needed roof replacement, a main panel upgrade or an oversized system stretch it. Adding an EV changes the math too, since charging an EV in California on utility power is expensive and solar can cover much of it.
For a deeper look at how rising rates change these timelines, see how rising electricity rates are shortening solar payback.
In 2026, California homeowners have no federal homeowner tax credit, but they can still use local utility rebates, state battery programs for qualifying households, and a property tax exclusion that ends for systems completed after December 31, 2026.
The federal residential clean energy credit (Section 25D) ended for homeowners on December 31, 2025. Systems you buy with cash or a loan in 2026 do not qualify. Third-party-owned systems, such as prepaid leases, can still use a separate commercial credit, which is one reason those options have grown. The full list of remaining programs is in solar incentives still available in 2026.
The Self-Generation Incentive Program (SGIP) has funded home batteries for years, but most residential money is spoken for. As of fall 2026, PG&E lists the SGIP General Market battery rebate as closed to new applications, and the income-qualified Equity, Equity Resiliency and Residential Solar and Storage Equity budgets run on waitlists.
Income-qualified households can still receive up to $1,100 per kWh of storage through the equity budgets when funds open. Check current status at selfgenca.com, and see who qualifies for SGIP in 2026.
City-owned utilities offer the strongest local incentives right now:
SCE, PG&E and SDG&E do not offer upfront solar rebates to general-market customers in 2026.
California law excludes a new solar system's added value from your property tax assessment. SB 710, signed in October 2025, protects that break for systems completed before January 1, 2027, for as long as you own the home. No extension passed in 2026, so systems completed after December 31, 2026 will not qualify.
Many assessors read "completed" as fully operating with utility permission to operate (PTO), so timing matters if you sign this fall. Details are in California's solar property tax exemption after 2026.
Paying cash gives you the lowest lifetime cost, but a prepaid lease often has the lowest upfront price in 2026 because the system owner can still claim a commercial tax credit and pass that value to you. A loan sits between the two.
Cash buyers own the system on day one, keep all savings, and add resale value to the home. The trade-off is the full upfront price with no federal credit to offset it in 2026. Cash usually gives the best 25-year return if you have the savings and plan to stay.
A loan lets you own the system with little or no money down. Your monthly payment replaces part of your utility bill, and your savings grow once the loan is paid off. Interest adds to the total cost, with 2026 solar loan programs commonly quoting APRs in the high single digits to low double digits depending on credit. Ask about prepayment terms and what happens if you refinance your home.
The Propel prepaid lease, offered through SolSource, is US Power's main lease option. You prepay the agreement once, either in cash or with a fixed-payment loan, and SolSource owns the system for the early years. Because the owner claims the commercial clean electricity credit, the prepaid price is typically lower than buying the same system outright, and Propel's distributor has said discounts can reach 25% or more.
You get fixed costs with no payment escalator, and the owner handles maintenance and production guarantees during the managed period. You can take ownership after year five. If a prepaid lease cut the $31,500 solar-plus-battery system above by 25%, payback would drop to about 8 years. For the full mechanics, read how the Propel prepaid lease works.
Monthly leases and power purchase agreements (PPAs) require little or no money down. You pay a monthly amount or a per-kWh rate that is set below your utility rate. Read the escalator clause carefully, since even a 2.9% yearly increase compounds over 20 to 25 years. For a side-by-side view, see whether to buy or lease solar panels in 2026.
California's per-watt solar price sits near the middle of the states US Power serves, but its electric rates are roughly double those in Texas and Florida. That rate gap is why California payback periods stay competitive even under NEM 3.0.
| State | Average cost per watt and residential rate | What shapes the math |
|---|---|---|
| California | $2.52/W, 34.7 cents/kWh | NEM 3.0 low export credits (except LADWP and some city utilities); batteries common |
| Texas | $2.25/W, 15.9 cents/kWh | No statewide net metering; buyback plans vary by retail provider; property tax exemption on solar value |
| Florida | $2.12/W, 15.1 cents/kWh | Net metering at major utilities; sales and property tax exemptions |
| Illinois | $2.98/W, 19.9 cents/kWh | Illinois Shines renewable energy credit payments |
| Connecticut | $2.67/W, 24.3 cents/kWh | Residential Renewable Energy Solutions tariff; Energy Storage Solutions battery incentives |
| New Jersey | $2.59/W, 24.9 cents/kWh | SREC-II payments under the state's solar program; sales tax exemption |
| Pennsylvania | $2.58/W, 21.7 cents/kWh | Net metering at most utilities; no statewide rebate |
Sources: per-watt averages from ConsumerAffairs' August 2026 state cost guide; residential rates from EIA data for June 2026. Typical system sizes are larger in Texas, Florida and the Northeast, so total prices there often run higher than California's even at a lower cost per watt.
The takeaway for California readers is simple. You pay a similar price per watt, but every kWh your panels produce offsets electricity that costs about twice the national average of 18.4 cents.
Prices are drifting down slowly, but waiting rarely pays. Berkeley Lab's data shows the national median installed price fell about 12% from 2024 to 2025, yet a California home paying $250 a month spends $3,000 a year on electricity while it waits.
Waiting also has a deadline cost in 2026. Systems completed after December 31, 2026 lose the state property tax exclusion, and the commercial credit behind prepaid leases requires solar to be placed in service by the end of 2027. For the full argument, see whether solar prices will drop and what waiting costs.
A fair 2026 California quote usually lands between $2.50 and $3.60 per watt for solar alone, with a clear line-item price for any battery. These steps help you stay in that range.
A quote built on one summer bill can easily oversize or undersize your system. Ask for a proposal based on a full 12 months of usage data from your utility account, and check that the projected production roughly matches your yearly kWh.
Divide each quote's price by the system size in watts. This puts a 6.4 kW and a 7.2 kW proposal on equal footing. Then compare panel brand, inverter type and warranty length. The Qcells vs Canadian Solar comparison shows how panel choice changes value.
Ask whether workmanship, equipment and production are covered under one warranty or three separate ones, and for how long. Confirm the company holds an active CSLB license on the state's website.
Every week between signing and permission to operate is another week at full utility rates. With the property tax deadline approaching, ask each installer for a realistic date. If a price feels high, here is what actually works when you negotiate a solar quote.
The solar panel cost California homeowners pay in 2026 averages about $21,000 for an 8 kW system, with a battery adding roughly $13,500. With average rates near 34 cents per kWh at SCE and PG&E and over 45 cents at SDG&E, most homes recover that cost in about 7 to 11 years and then keep saving for decades.
US Power starts every consultation with a real 12-month bill analysis, so your system is sized to your actual usage, not a guess. You get American-made Qcells panels at factory-direct pricing, a 25-year comprehensive warranty, and a typical 3 to 4 week timeline from signing to PTO, which can still matter for this year's property tax deadline. You can book your free 12-month bill analysis and see exactly what solar would cost for your home.
Your roof is already collecting the sunlight. The only question is who gets paid for it.


Installers just exposed the hidden cost of bargain solar. Things you should avoid.
Learn more about why owning solar beats leasing in Southern California 2025.
Refinancing your home? Here is exactly what happens to your solar loan first.









Copyright © 2026 US Power - Axia by QCells. All Rights Reserved.
Get an instant solar estimate using satellite!